Advanced Data Visualization Design System by Mingzhi Cai |
Home > Winners > #154750 |
 |
|
||||
| DESIGN DETAILS | |||||
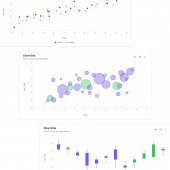
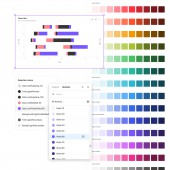
| DESIGN NAME: Advanced Data Visualization PRIMARY FUNCTION: Design System INSPIRATION: Recognizing the escalating demand for articulate data representation, I synthesized insights from age-old charting techniques, modern digital representation platforms, and direct feedback from seasoned designers. The aim is to architect a tool that marries aesthetics with unmatched utility. UNIQUE PROPERTIES / PROJECT DESCRIPTION: This groundbreaking design system unveils an expansive and robust chart library tailored for swift prototyping in Figma. Covering all common chart types, it ensures designers no longer need to build visualizations from scratch. By simply grabbing the desired charts, a full-fledged dashboard design can be assembled in mere minutes. Championing design consistency across adaptive palettes, flexible elements, and editable data markers, this library is revolutionizing the realms of UX design and prototyping, presenting a harmonious blend that accelerates the design process while unfurling a canvas for boundless creativity. OPERATION / FLOW / INTERACTION: With intuitive drag-and-drop capabilities, designers can seamlessly populate their canvas. Every component is malleable—colors shift, data markers adjust, and resizing remains hassle-free. I've incorporated predefined interaction states, streamlining the visualization of user touchpoints. PROJECT DURATION AND LOCATION: 2023, New York City FITS BEST INTO CATEGORY: Interface, Interaction and User Experience Design |
PRODUCTION / REALIZATION TECHNOLOGY: Developed as a Figma-based design system library with components and color palettes. SPECIFICATIONS / TECHNICAL PROPERTIES: The design system is offered as a Figma file with components organized into frames for easy access. It includes over 100 unique components, with robust variations, and supports responsiveness. TAGS: Data visualization, Figma, Design system, Charts, Interactive, UI/UX, Prototyping, Dashboards, Analytics RESEARCH ABSTRACT: The development began with my experience in dashboard design and inputs from my coworkers regarding data representation. I then initiated this project aiming to create a highly robust and easy-to-configure chart library. I turned my observation into emphasizing the importance of modifiability, a broad range of chart types, and the flexibility of integrating with other design systems. CHALLENGE: The pivotal challenge lies in marrying aesthetics with adaptability. Building a cohesive yet flexible system demanded rigorous, iterative fine-tuning. Performance optimization, especially when juxtaposed with intricate designs or voluminous data, was a formidable challenge I tackled head-on. ADDED DATE: 2023-09-27 13:57:42 TEAM MEMBERS (1) : Mingzhi Cai IMAGE CREDITS: Mingzhi Cai, 2023. |
||||
| Visit the following page to learn more: https://www.figma.com/community/file/125 |
|||||
| AWARD DETAILS | |
 |
Advanced Data Visualization Design System by Mingzhi Cai is Winner in Interface, Interaction and User Experience Design Category, 2023 - 2024.· Press Members: Login or Register to request an exclusive interview with Mingzhi Cai. · Click here to register inorder to view the profile and other works by Mingzhi Cai. |
| SOCIAL |
| + Add to Likes / Favorites | Send to My Email | Comment | Testimonials | View Press-Release | Press Kit |


