DESIGN NAME:
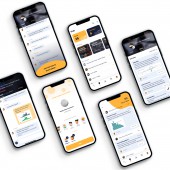
DataX
PRIMARY FUNCTION:
Analytical Application
INSPIRATION:
During a large conference, attendees have common frustrations including cannot sync to the content presented on stage (if being late), no way to validate speakers' opinions, feeling difficulty interacting with other unknown attendees, and building up post-conference networking. This design aims to solve these problems to bring attendees a seamless experience and allow them to contribute to the social topics that are discussed at the conference.
UNIQUE PROPERTIES / PROJECT DESCRIPTION:
It's the first APP that allows attendees to play with the real-time on-stage dataset, create inspiring visualizations, and bring their ideas to other attendees and even speakers. It aims to provide equal opportunities to all attendees, including those who have vision problems, who are deaf-mutes, and who are unconfident on social networking, to learn and shine.
OPERATION / FLOW / INTERACTION:
Attendees can find what ongoing panels of this conference and in which rooms are they on the dashboard. Then sync to the slide that's being presented on stage with their phone, and they can magnify to edit, then share the edited slide to the hub and ask questions to get help from other attendees. With the built-in analytical tool, attendees can also sort, filter, aggregate, and visualize the speaker's dataset and share their ideas to the panel group to make contributions and impact.
PROJECT DURATION AND LOCATION:
The project started in Aug 2021 and finished in Feb 2022 in New York City.
FITS BEST INTO CATEGORY:
Interface, Interaction and User Experience Design
|
PRODUCTION / REALIZATION TECHNOLOGY:
This APP features a powerful data analytics tool that automatically extracts and categorizes the variables of presented datasets (csv. format) into option buttons, and presented to attendees in a human language structure "I want to (measuring method) (measuring object) in (condition)". For the visualization feature, the APP will recommend the most suitable chart styles based on the nature of the dataset to attendees and allow them to merge duo datasets into one.
SPECIFICATIONS / TECHNICAL PROPERTIES:
The APP can work for mobile screen sizes from 375x667(iPhone 8) to 428x926(iPhone 13 Max) and should be compatible with both iOS and Android systems. The APP can be downloaded by scanning the QR code and being redirected to the link created by the conference organizers. It's primarily for mobile devices for allowing attendees to have handy tools and guidebooks of the conference without the need of bringing their bulky laptops.
TAGS:
Interaction Design, Mobile Application, UX Design, Data Analytics Tool, Digital Service Design
RESEARCH ABSTRACT:
I conducted qualitative and quantitative research on real attendees and organizers. Methodologies used include focus groups, questionnaires, and user journey mapping. After initial research, I also conducted several runs of moderated usability testing with prototypes and well-designed tasks with participants to guide the iterations. Tools used include Sketch, Adobe XD, Airtable, Balsamiq, Google Doc, etc.
CHALLENGE:
There are no similar products on the market so nearly nothing to refer to. Also, most analytical tools are not friendly for small screens, so I ran research to understand what's the core features and how to make them intuitive for attendees with little analytics background. Recruiting testing participants was also hard because I had to try to include as many types of attendees as I can, including but not limited to disables, seniors, non-analytics-proficient users, deaf and mutes, etc.
ADDED DATE:
2022-03-09 18:00:48
TEAM MEMBERS (1) :
IMAGE CREDITS:
Xiaorui Zhu, 2021.
|


